Fire protection is one of the most visible and vital services cities provide regarding public safety. But how many fire stations are enough—and at what cost?
Let’s examine El Cerrito’s performance in terms of fire station density, risk exposure, and financial sustainability compared to other Contra Costa County cities.
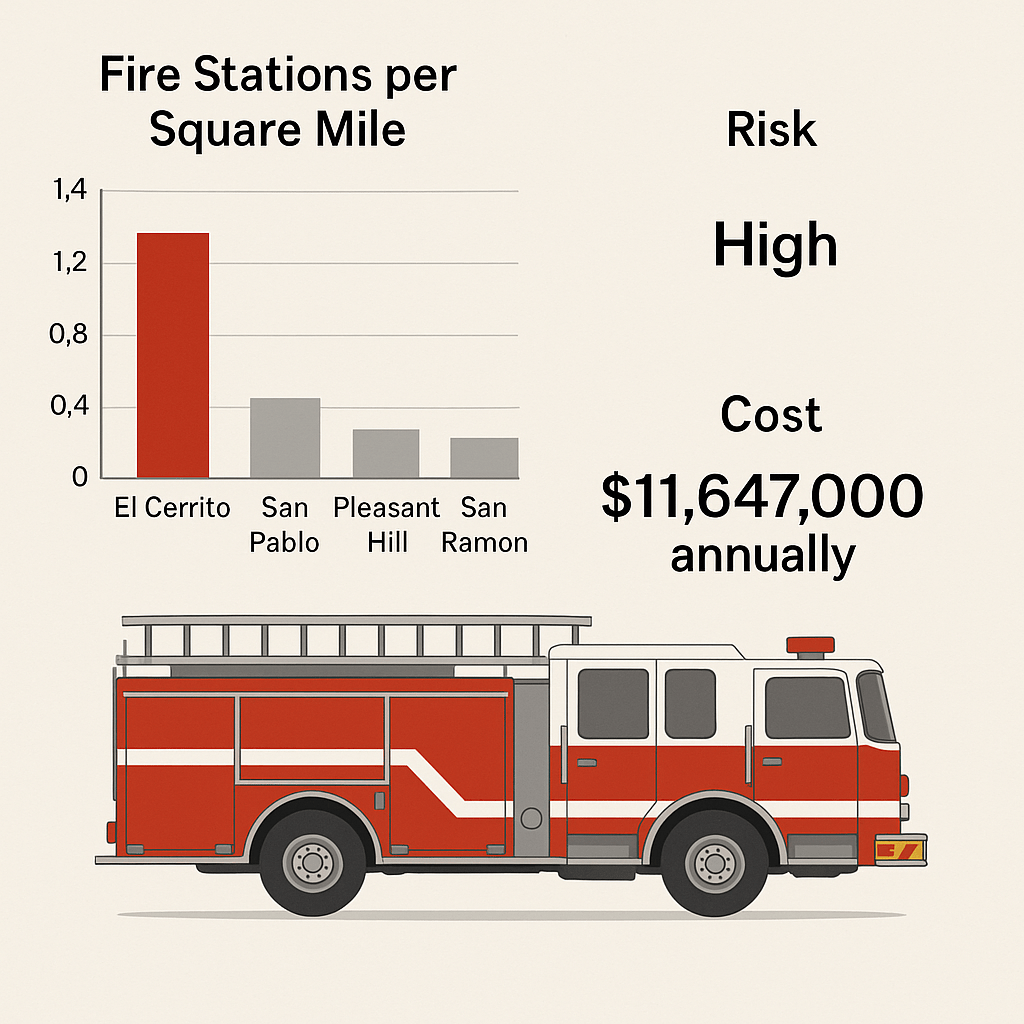
More Fire Stations per Square Mile than Any Other City
El Cerrito and Kensington have three fire stations serving a combined area of 4.2 square miles, resulting in approximately 1.4 square miles per station—the most concentrated fire coverage in Contra Costa County. This high density of fire stations is complemented by a robust leadership structure, including four battalion chiefs, which is notable given the city’s size.
Battalion Chief Staffing Across Contra Costa County
The Contra Costa County Fire Protection District (Con Fire) oversees 26 fire stations across four battalions, managed by 10 battalion chiefs. This structure averages to about 2.5 battalion chiefs per battalion. In contrast, El Cerrito’s four battalion chiefs for three stations indicate a higher leadership-to-station ratio.
Other cities in the county, such as San Pablo and Pleasant Hill, typically operate with fewer battalion chiefs, often sharing resources through mutual aid agreements. For instance, the Richmond Fire Department supervises eight companies with a single battalion chief per shift.
Notably, one of El Cerrito’s battalion chiefs is assigned solely to Training. While training is important, it typically does not require a high-ranking, high-salaried staff person to manage it full-time—particularly in a city of this size. Other cities coordinate training through shared services, rotating command staff, or specialized support roles that don’t carry the same cost burden.
Financial Implications
El Cerrito’s four battalion chiefs collectively cost approximately $2 million annually. This expenditure is significant when compared to the city’s overall fire department budget and raises questions about financial sustainability, especially in light of pension liabilities and structural deficits.
In comparison, the Contra Costa County Fire Protection District’s general fund budget for the fiscal year 2023-2024 is $219.3 million. While this larger budget supports a broader area and more extensive services, the per capita and per station expenditures may offer insights into potential efficiencies.
Given the high density of fire stations and the substantial investment in leadership, El Cerrito may benefit from evaluating its fire department structure. Potential considerations include:
- Resource Allocation: Assessing whether the current number of battalion chiefs aligns with operational needs.
- Regional Collaboration: Exploring partnerships with neighboring cities to share leadership roles and reduce costs.
- Operational Efficiency: Analyzing call volumes and response times to determine if resources are optimally deployed.
Engaging in a community dialogue about these considerations can help ensure that El Cerrito maintains effective fire protection services while also addressing financial sustainability.
Time for a Community Conversation
The question isn’t whether El Cerrito needs fire protection—it does. The question is whether the current configuration reflects the most innovative use of resources, particularly given the city’s:
- Structural deficit
- Unfunded pension liabilities
- Competing infrastructure needs
Would regional collaboration, station reallocation, or a right-sized leadership model provide equivalent safety at a lower cost?
Residents deserve transparency, data, and discussion. When it comes to public safety and public dollars, effectiveness and efficiency matter.
Here is a comparative chart of Contra Costa County cities, detailing their area in square miles, number of fire stations, and the area covered per fire station:
| City/Town | Area (sq mi) | Fire Stations | Area per Station (sq mi) |
|---|---|---|---|
| El Cerrito/Kensington | 4.57 | 3 | 1.52 |
| San Pablo | 2.6 | 1 | 2.6 |
| Pleasant Hill | 7.1 | 2 | 3.55 |
| Clayton | 3.8 | 1 | 3.8 |
| Richmond | 30.1 | 7 | 4.3 |
| San Ramon | 18.6 | 4 | 4.65 |
| Walnut Creek | 19.8 | 4 | 4.95 |
| Pinole | 5.3 | 1 | 5.3 |
| Hercules | 6.0 | 1 | 6.0 |
| Danville | 18.0 | 3 | 6.0 |
| Orinda | 12.8 | 2 | 6.4 |
| Martinez | 13.1 | 2 | 6.55 |
| Lafayette | 15.4 | 2 | 7.7 |
| Pittsburg | 17.0 | 2 | 8.5 |
| Moraga | 9.4 | 1 | 9.4 |
| Alamo | 9.7 | 1 | 9.7 |
| Concord | 30.5 | 5 | 6.1 |
| Antioch | 29.0 | 3 | 9.67 |
| Brentwood | 14.0 | 1 | 14.0 |
| Oakley | 15.0 | 1 | 15.0 |
Note: The number of fire stations is based on available data and may vary over time.
This chart illustrates that the combined El Cerrito/Kensington area has the highest densities of fire stations relative to its area, with approximately 1.52 square miles per station. In contrast, cities like Oakley and Brentwood have larger areas per station, at 15.0 and 14.0 square miles, respectively.

my father in law was the SF Deputy Fire Chief appointed by Feinstein I asked him (he is still alive) the rule for Battalion Chief One Battalion Chief for each shift (24 hours is a shift) SF has 11 Battalion Chiefs for 39 square miles and billions of property value and hundreds of thousands of lives Go figure how El Cerrito rationalizes the need for 4?!
On Thu, May 22, 2025 at 1:24 PM El Cerrito Committee for Responsib
LikeLiked by 1 person