At the Tuesday, January 20, 2026 City Council meeting, expect a fair amount of congratulating.
There will likely be high-fives, back-patting, and reassuring statements about progress — particularly around the City’s summary of the 2025 National Community Survey (NCS), which shows an increase in overall confidence in City government.
According to the City’s published highlights, the percentage of residents expressing confidence rose from roughly 44 percent in 2022 to about 49 percent in 2025.
That improvement is worth acknowledging.
What’s harder to applaud is what hasn’t been shared — and what the City’s own chart quietly reveals.
What Residents Were Shown — and What They Weren’t
The City released a summary emphasizing improved confidence and satisfaction. What it did not release is the entire 2025 NCS report, including the full set of detailed tables that allow residents to understand how different aspects of community life are actually performing.
That distinction matters.
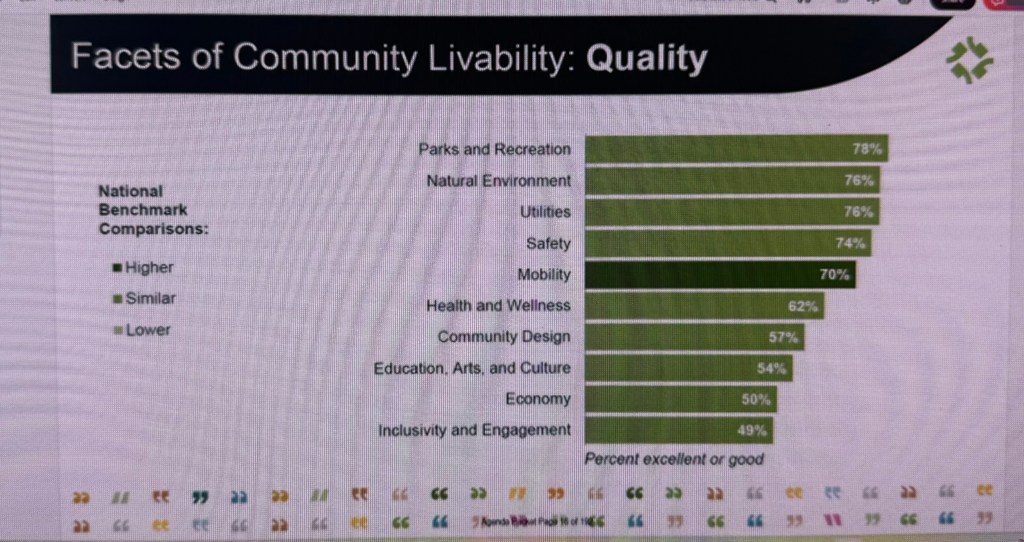
The chart summarizing Facets of Community Livability: Quality shows a clear pattern. Residents rate tangible services and physical amenities relatively well:
- Parks and Recreation (78%)
- Natural Environment (76%)
- Utilities (76%)
- Safety (74%)
- Mobility (70%)
These are areas where outcomes are visible and experienced directly.
But ratings fall sharply when the focus shifts from services to connection, participation, and economic conditions.
Inclusivity, Engagement — and the Economy — Tell a Different Story
At the bottom of the chart sit two of the most consequential indicators of community health:
- Economy: 50%
- Inclusivity and Engagement: 49%
These are not peripheral measures. They speak directly to whether residents feel economically secure, included in decision-making, and meaningfully connected to their community.
A 50 percent rating on the economy suggests residents are deeply split on whether El Cerrito is providing the conditions for stability and opportunity. A sub-50 percent rating on inclusivity and engagement signals that many residents do not feel seen, heard, or involved — regardless of how well parks or utilities perform.
Those numbers deserve more attention than they are receiving.
Confidence Up Does Not Equal Inclusion Achieved
A 55 percent confidence rating still means nearly half of residents are unconvinced, uncertain, or dissatisfied. That is not a mandate. It is a caution flag.
Confidence can rise temporarily based on tone, messaging, or selective framing. Inclusivity and engagement, by contrast, are built over time through openness, transparency, and a willingness to share the full picture — especially when results are mixed.
When only the strongest scores are summarized and the lowest-rated areas are downplayed, it reinforces the sense that participation is managed rather than invited.
The Irony Is Hard to Miss
If inclusivity and engagement were truly improving, then full disclosure should be easy.
Instead, residents are once again presented with highlights without context — celebration without scrutiny. That approach undercuts the very outcomes the City says it wants to improve.
You cannot strengthen engagement by withholding information that would allow residents to engage meaningfully.
The Fix Is Simple — and Still Available
El Cerrito does not need spin. It needs sunlight.
If the City wants to turn rising confidence into genuine inclusivity, engagement, and economic credibility, the next step is obvious.
Call to Action:
Release the entire 2025 National Community Survey report — including all detailed tables — so residents can see the full picture for themselves.
Engagement grows when information is shared, not curated.
